
24 Mar 2025
Too many uncertainties on the external front will likely hurt India’s GDP growth in the short term. But can these be turned into opportunities in the medium term? We go back in history to see what has worked in the past, and what has not. We analyse India’s economy over two periods –the ‘high growth’ decade, FY01-FY10, when India’s growth soared, alongside rising global export share and investment; and the ‘lower growth’ decade, FY11-FY20, when all three softened. How can India escape‘lower growth’ and ascend to ‘high growth’?
One key differentiating factor between the two periods was import tariffs, falling in the former, but rising in the latter. In fact, India’s import tariffs are amongst the highest globally, and were hurting exports even before the Trump administration put them centrestage. How have high tariffs hurt India? The economy has not fully plugged into global supply chains. One reason why China could raise its exporting strength (or its forward participation) was because it was open to importing (raising backward participation) before it became self-sufficient. Protectionist tendencies in India may have led to a premature clamping down of backward participation, hurting its export potential.
India’s FDI story also sheds light. After soaring in the pandemic period, high-tech FDI has fallen, as global competition has picked up. What India seems to have overlooked is mid-to-low tech FDI in labour intensive manufacturing sectors like food, apparel, furniture, and toys, which stagnated in the ‘lower growth’ period. In fact, India did not gain as much as ASEAN in these sectors during the first Trump Presidency. But if supply chains are rejigged during the second Trump Presidency, following higher tariffs on current large exporters, and the world looks for new producers, India may get a second chance. If sectors such as electronics, apparel, furniture, and footwear, where Vietnam made significant progress in the first Trump Presidency, is a reflection of where global opportunities from supply rejigging lie, it is worth noting that India is already a player, with room to grow. Incidentally, China’s excess capacity is not as large in these mid-to-low tech sectors. Space for another manufacturer may well be there.
But first India needs to make changes. And there is good news here. Potential US tariffs may have become a catalyst for reforms –lowering import tariffs, opening up to regional FDI, fast-tracking trade deals, and making the INR more flexible. And India does not have to look too far for models to emulate. Its success in services exports has demonstrated the power of moving up the value chain, from basic (e.g. call centre services) to high-tech (professional services). But for similar success in goods trade,reforms must run deep.
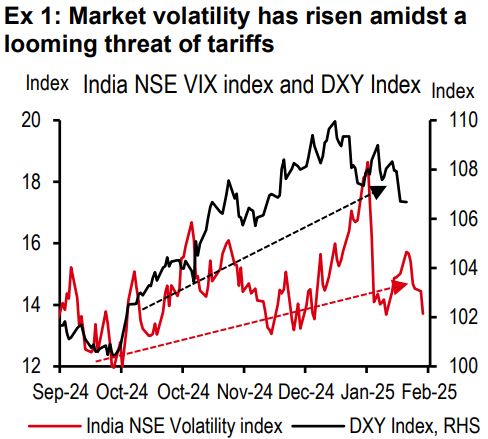
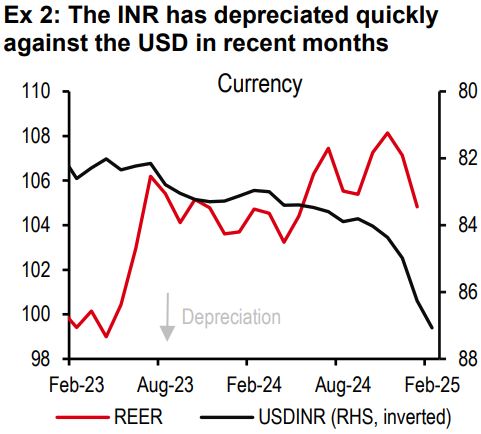
There are too many uncertainties on the external trade and tariffs front (see exhibits 1 and 2). Higher tariffs on India’s exports will likely lower its GDP growth directly (for instance, as we discuss later, reciprocal tariffs could lower India’s GDP growth by about 0.3ppt), and indirectly (for instance via lowering global FDI flows). In this report, however, we look beyond the immediate impact, and how this adverse shock can be turned into an opportunity. After all, in the past India has reformed best in periods of crisis (a la 1991).
We go back into history to understand what worked in the past, and what has not. We analyse India’s economy and its external finances over various periods, and a few lessons are clear. If India can dare to be different by opening up for business by lowering tariff and non-tariff barriers, and be more welcoming of regional FDI in labour-intensive sectors, even as the world is turning more protectionist, it could more meaningfully plug into global value chains, and in the process create more jobs and growth.
India may have already embarked on this journey, but success will depend on how far it is ready to go. Let us elaborate.
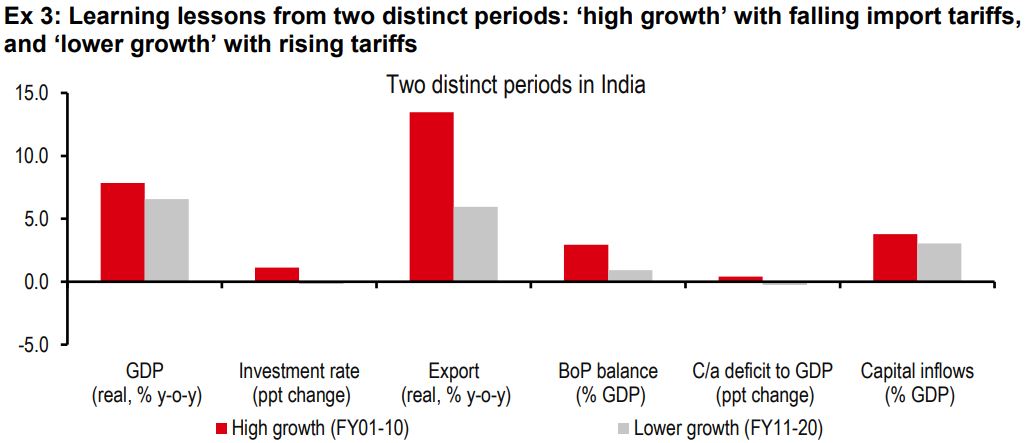
Two distinct periods in India show good insights: FY01-FY10 and FY11-FY20 (see exhibit 3).
High growth FY01-FY10: This period showed high GDP growth (averaging 7.8% per year), rising investment (by 1.1% of GDP per year), and strong export growth (13% per year in real terms). India’s global export share more than doubled in this decade.
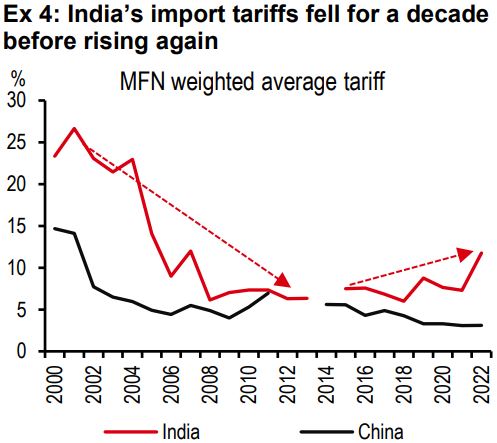
This was a period when India was cutting import tariffs (even bringing them down to where China’s tariffs were by 2010, see exhibit 4). There were high imports too, leading to a worsening of the c/a balance (by 0.3% of GDP per year). But because growth was strong, so were capital inflows. The c/a deficit was easily funded, leaving behind a high BoP surplus (2.9% of GDP).
Lower growth FY11-FY20: The next decade was quite the opposite. GDP growth was lower (average 6.6% per year), investment weaker (falling by 0.2% of GDP per year), and export growth softer (6% per year). India’s global export share was broadly stagnant in this period.
This was a period when India’s import tariffs stopped falling, and even started to rise from 2018 onwards (see exhibit 4). Imports were low too, leading to an improvement in the c/a balance (of 0.3% of GDP). But because the growth prospects were weaker, capital inflows were softer, leaving behind a smaller BoP surplus (0.9% of GDP).
What is clear from these periods is that high growth is a function of strong investment and export, and has been experienced best at times of falling import tariffs. The worsening of the c/a balance during the higher growth period has not been a problem, because it was fully funded by higher capital inflows.
The challenge for India is to break out of the ‘lower growth’ track, and ascend to ‘high growth’. What can it do right?
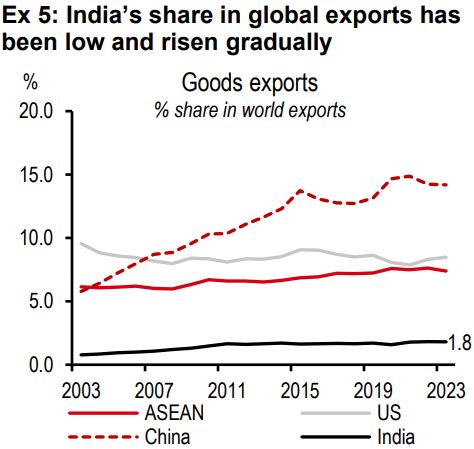
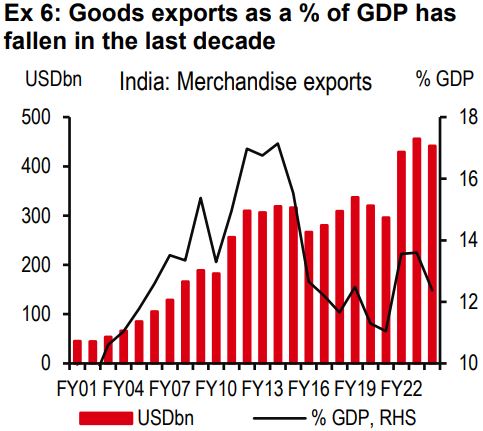
India’s share in global merchandise exports has been low and sluggish (see exhibits 5 and 6).
The obvious next question is why? Although global liquidity was lower in the ‘lower growth’ period than the ‘high growth’ period, all countries should have suffered. Why did India’s export share stagnate? There could be many reasons, such as the hurdles around the ease of doing business and quality of infrastructure, but what stands out for us in the current environment is elevated tariffs.
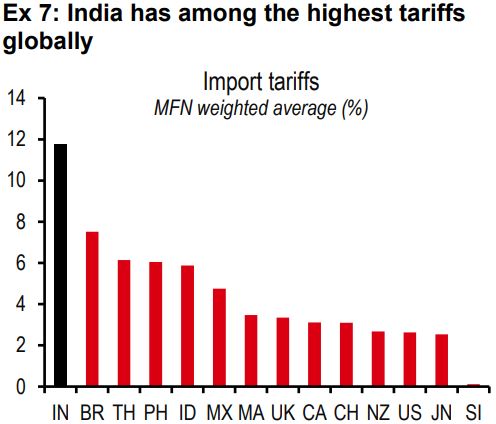
India has had amongst the highest import tariffs (see exhibit 7), and they have been on the rise (see exhibit 4, although this does not include some cuts in the recent budgets). Non-tariff barriers are also rife (although harder to quantify). WTO data shows that India ranked second after China in imposing antidumping measures against the US. Quality control orders (QCOs) are also on the rise (from 14 notified in 2014 to 186 notified in 2024). These orders are quality standards imposed on imports. They are meant to ensure quality and safety, but can also double up as non-tariff barriers.
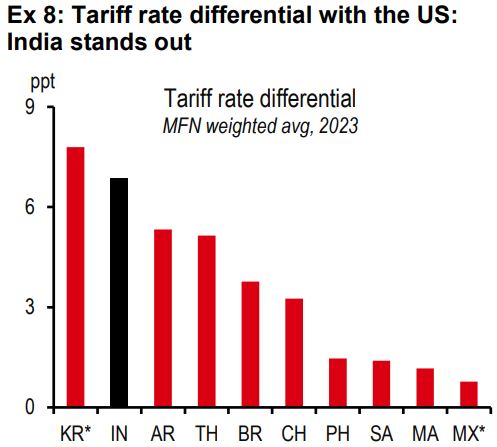
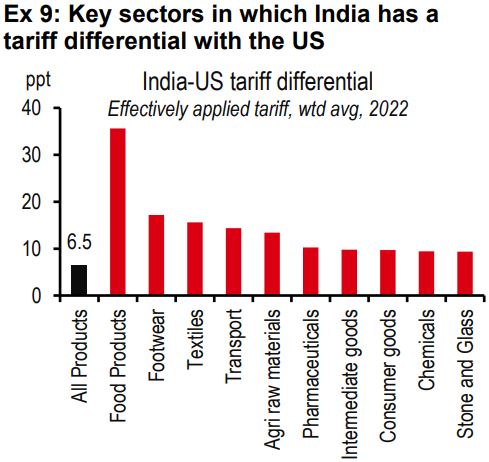
India’s high tariff and non-tariff barriers have begun to stand out at a time when President Trump has suggested reciprocal tariffs on India’s exports (see exhibit 8), although it is not clear what form reciprocal tariff increases will take, or the likely timeline. Going by the tariff differential with the US, the sectorsmost impacted could be agriculture, automobiles, jewellery, and pharmaceutical products (see exhibit 9).
All said, these tariff barriers were already hurting India, even before the Trump administration brought them centre stage. Next, we explore how exactly India has been hurt by high tariffs by undertaking a comparative assessment of India and China in trade integration.
Our India and China analysis uses OECD’s trade in value added (TiVA) database, which helps understand how economies have become integrated into global value chains over time.
We use two concepts, backward and forward participation, both expressed as a share of an economy’s gross exports. Backward participation refers to the use of foreign-sourced inputs to produce a country’s exports, and forward participation refers to the use of domestically produced value-added in a foreign countries’ exports.
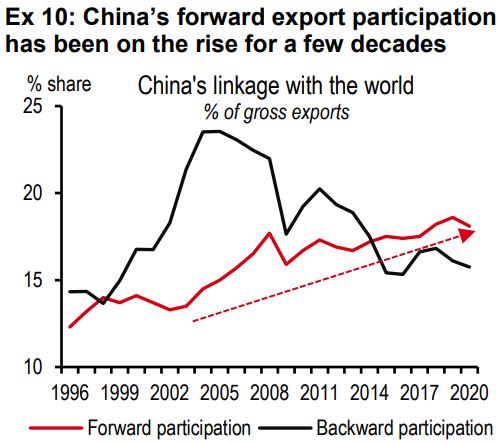
In the case of China, the forward participation has been on the rise for a few decades, making more countries dependent on Chinese produce (see exhibit 10). No surprise that China’s global export share has continued to rise.
An important enabler in the process was falling tariffs throughout the period, and higher imports, at least initially. China’s backward participation shows that the reliance on imported inputs increased for several years, before China deepened its manufacturing and became more self-sufficient.
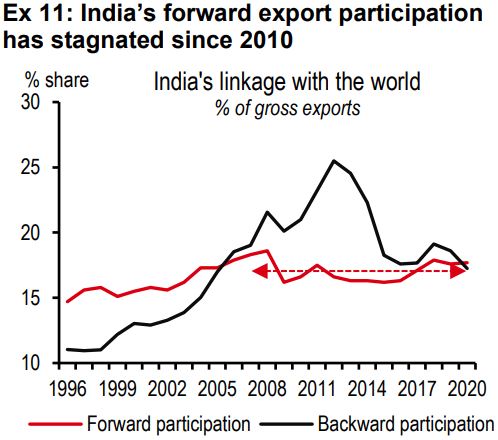
In the case of India, we go back to the ‘high growth’ and ‘lower growth’ periods referred to above. Forward participation was rising until about 2010, after which it stagnated (see exhibit 11). Backward participation increased in the ‘high growth’ period, but declined in the ‘lower growth’ period, when import tariffs began to rise. The high tariffs may have made it costly to import, and given that the intermediary inputs industry had not developed by then, India’s forward participation, or more broadly, itsexport potential, suffered.
India may have become a victim of premature protectionism. But this can now change, and there are some nascent signs (more later).
Having analysed trends in external trade, we move to its funding counterpart, i.e. foreign direct investment (FDI). What’s gone on there?
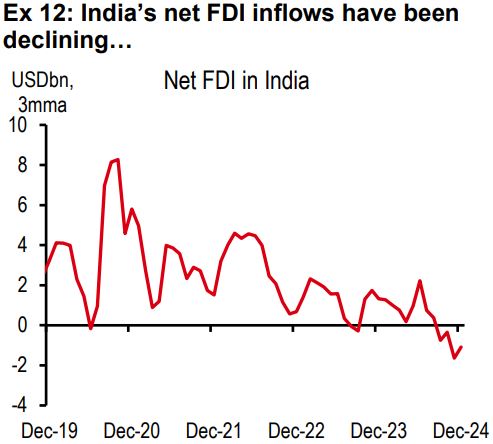
Net FDI into India increased appreciably in the five years before the pandemic (from USD22bn in FY14 to USD31bn in FY19). During the pandemic it increased further (to USD44bn in FY21).
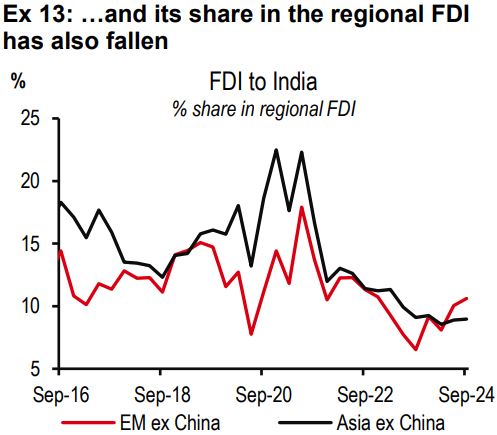
Thereafter net FDI has been declining sharply, now to about USD3.5bn (sum of the past four quarters, see exhibit 12). India’s share in regional FDI has also declined (exhibit 13). Which parts of FDI flows have led to this?
To recap the definitions: Net FDI: FDI to India –FDI by India; FDI to India: Gross FDI –repatriation.
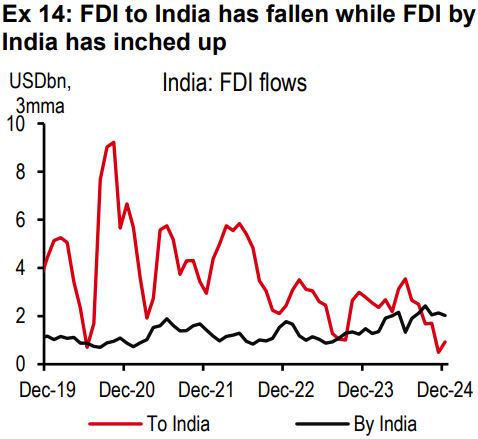
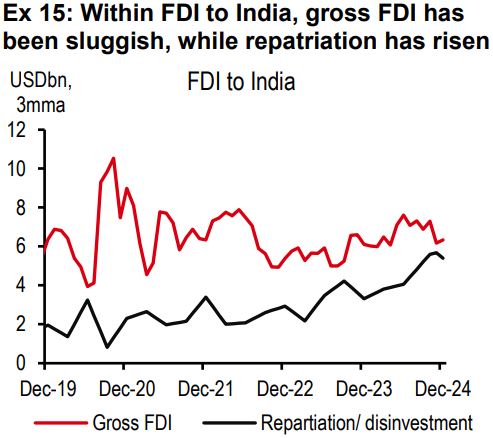
We find that FDI to India has fallen while FDI by India has inched up (see exhibit 14). And within FDI to India, gross FDI has been sluggish, and repatriation has risen(see exhibit 15).
The rise in repatriation is not too great a concern in our view, as it is largely secondary sales and IPOs by MNCs as well as exits by PE firms, and perhaps adds to investor confidence that investing in India can be profitable.
What bothers us is that gross FDI has been more sluggish than one may have expected given India’s strong growth potential in the few years following the pandemic.
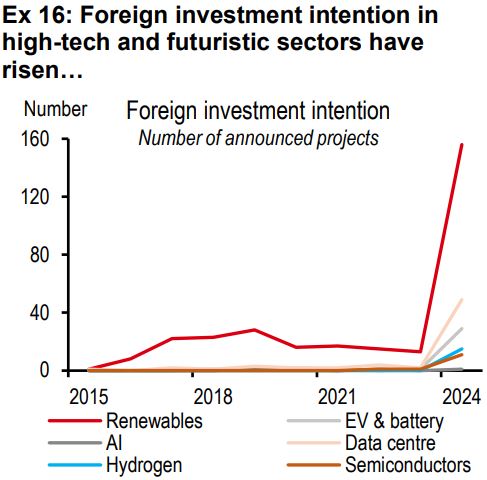
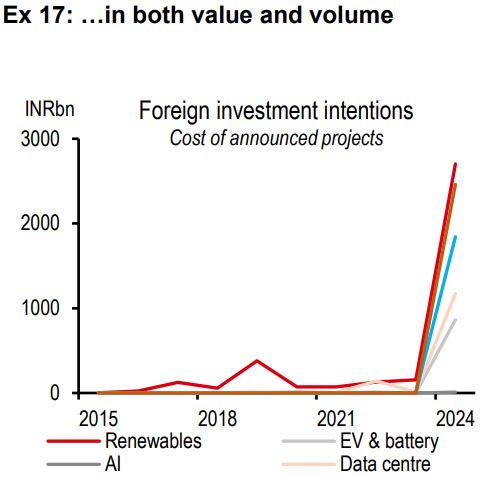
The mystery thickens when we find that throughout this period, foreign investment intention in high-tech and futuristic sectors such as renewables, semiconductors, green hydrogen, and data centres was strong (see exhibit 16 and 17). Some of this pledged money never came.
Looking closer we find that much of the FDI instead went to advanced economies, in several instances where large government incentives made it attractive. In fact, 23% of global FDI in 2023 went to the US alone.
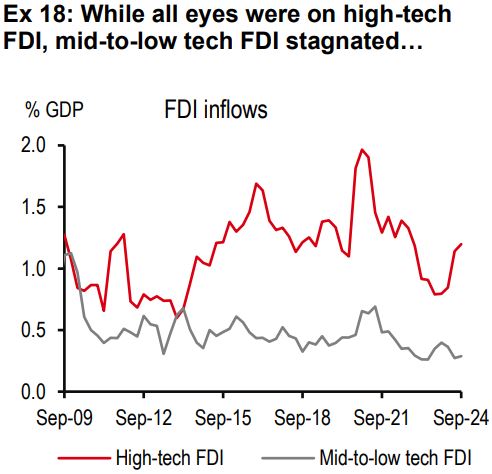
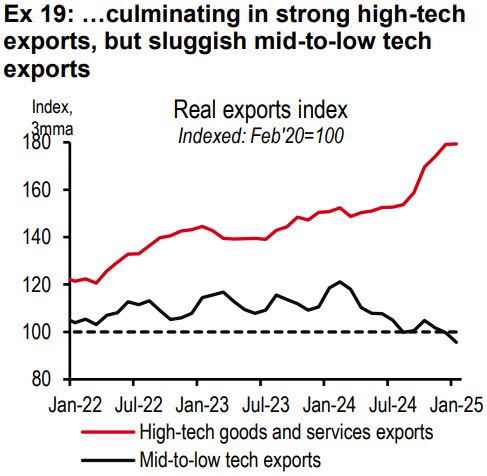
Our constructed indices show that much of the FDI boost in the pandemic period was led by high-tech sectors such as autos/EVs, electronics, pharmaceuticals, and computer services (see exhibit 18)[@india-economics-01-01]. This FDI culminated in strong growth in high-tech exports (see exhibit 19). And it is this FDI segment that declined in recent quarters given the fierce global competition (as other economies, some with deeper pockets to give subsidies, are competing for the same funds).
While high-tech FDI is critical for growth, what seems to have been overlooked is the other half –mid-to-low tech FDI. This includes foreign investment that fuels the more labour intensive sectors such as food, textiles, furniture, and toys. This has stagnated in the ‘weaker growth’ period (falling from 40% of overall FDI in 2000-10 to 30% in 2011-17, and further to 25% in 2018-24).
No surprise that India’s mid-to-low tech exports have also been weak.
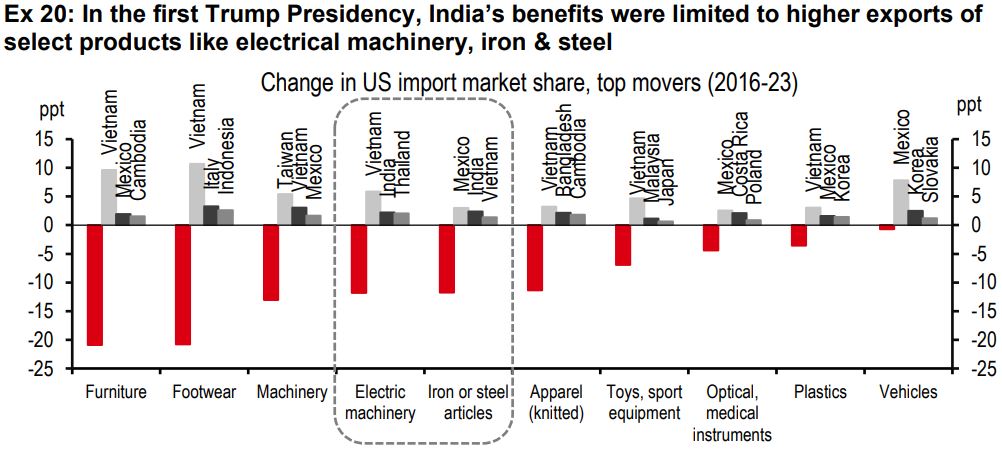
As a result of elevated tariffs and soft mid-to-low tech FDI, we believe India was not able to fully seize the opportunities in the first Trump Presidency, when supply chains were rejigged following the imposition of new and elevated tariffs.
Did India benefit at all? Yes, but narrowly. It did gain market share in the export of electronics and iron & steel articles (see exhibit 20). But it was not able to gain significant market share in most other sectors, largely mid-tech (e.g. furniture, footwear, apparel, and toys), as well as some high-tech (e.g. machinery, instruments, and vehicles).
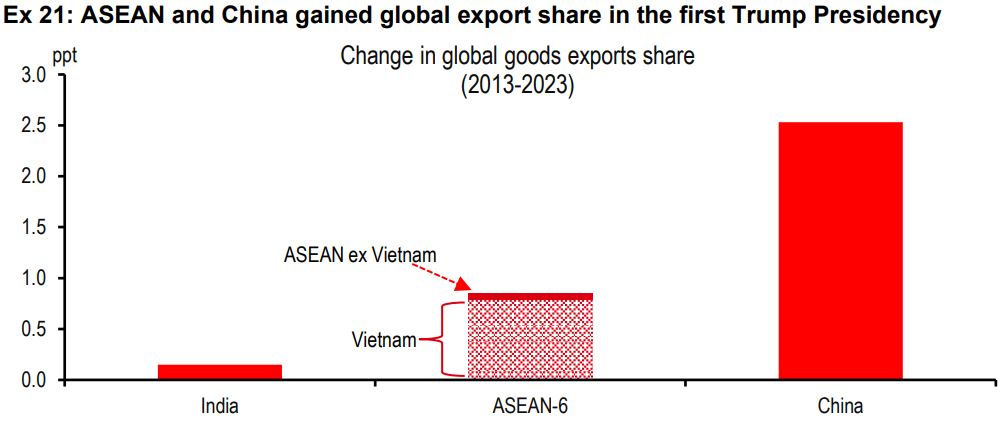
Other blocks like ASEAN made more progress in raising their global export share (see exhibit 21). Vietnam, in particular, made substantial gains in both mid-to-low tech and high-tech sector exports.
If supply chains are rejigged again during the second Trump administration, India may have a chance to grow. If the sectors where Vietnam made most progress during the first Trump administration is a reflection of where global opportunities from supply rejigging lie, note that India is already a player in these sectors.
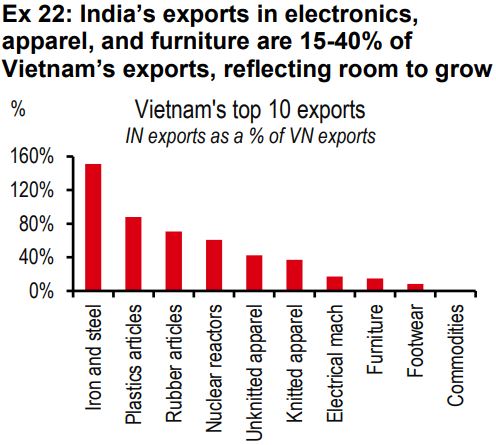
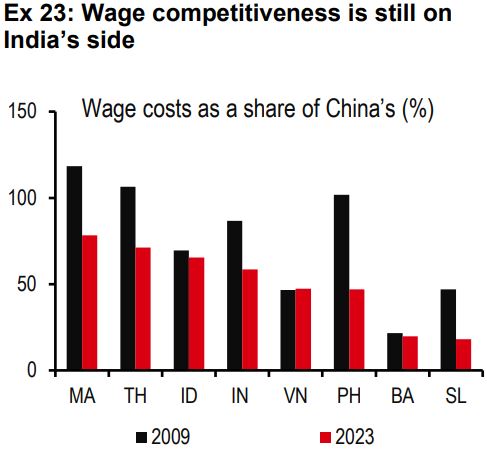
India’s exports in sectors like electronics, apparel, furniture, and footwear are 15-40% of Vietnam’s exports (see exhibit 22). This shows that India’s footprint is large enough to show capability, but with room to grow. After all, wage competitiveness is still on India’s side (see exhibit 23). But what does India need to do right this time around?
There are two obstacles for India to overcome before it can increase goods manufacturing and exports –the potential US tariffs under the second Trump Presidency and China’s excess capacity. Let’s address both:
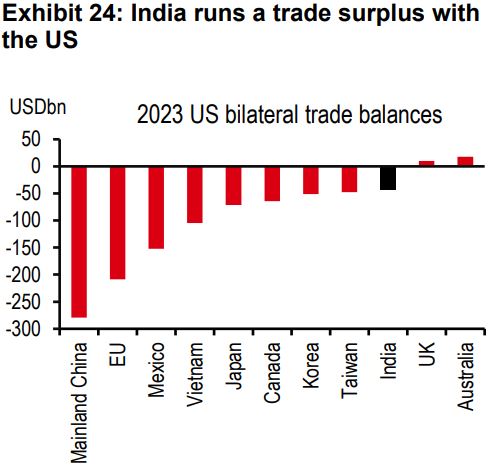
US tariffs. India stands out because of its trade surplus with the US (see exhibit 24). Back of the envelope estimates show that reciprocal tariffs could shave off growth by 0.3ppt (although there are many uncertainties around the details)[@india-economics-01-02]. And then there are plans to impose a 25% tariff on pharma and iron and steel products, which could hurt exports further.
But these threats could also become a catalyst for India to change a few things that kept it from becoming a larger manufacturing nation. In fact, it is already changing course on several fronts, becoming more ‘open for business’.
As supply chains become rejigged once again, as they did during the first Trump Presidency, and the world looks for new countries to manufacture from, India may have an opportunity to grow its manufacturing sector and exports.
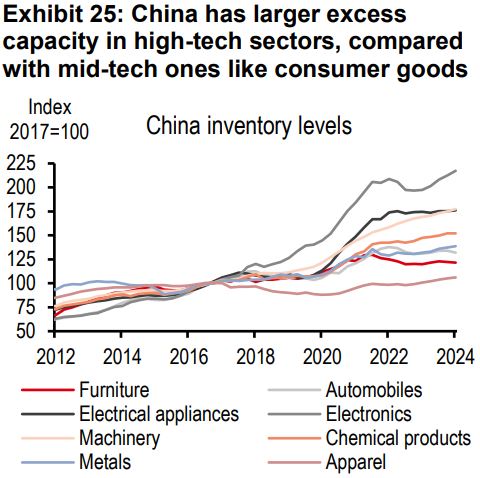
China’s excess capacity: Another concern would be the challenge of growing exports at a time of excess capacity in China.
Here, we find that while China may have overcapacity in some sectors like electronics, electrical appliances, and automobiles, the same may not be true for other sectors, like furniture, apparel, and chemical products (see exhibit 25).
In fact, ASEAN has shown that growing export share despite Chinese overcapacity is possible. Its trade balance is better than pre-pandemic levels for several consumer manufactured goods. Therefore, we believe there are opportunities to grow, despite excess capacity in some pockets.
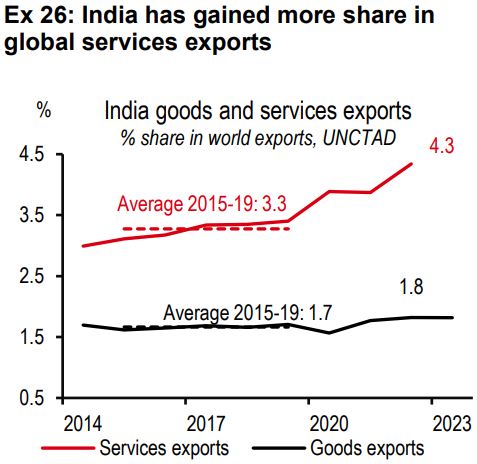
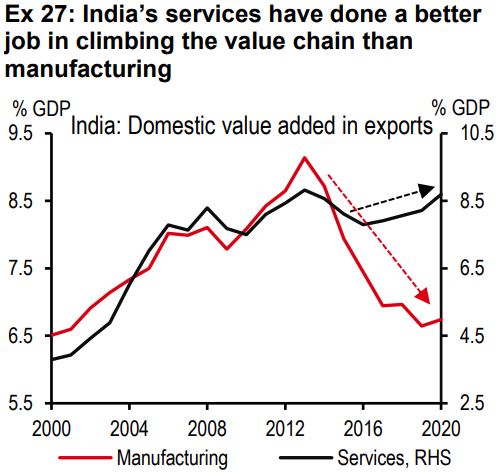
India’s services have done a better job in climbing the value chain than manufacturing (see exhibit 26 and 27). From a focus on call centres in the 1990s, to software solutions in the early 2000s, it is now a seller of complex professional services.
In the case of manufacturing, India may have tried to jump directly to high-tech without first going through low and mid-tech.
This is not to lower the importance of high-tech manufacturing. It is more to say that lessons from low and mid-tech manufacturing can make India an even better high-tech manufacturer.
All said, we do not want to underestimate the challenges of navigating a world with rising protectionism and excess capacity. But we believe that if India remains focussed on being ‘open for business’, it could benefit from supply chain rejigging in response to tariffs on key exporters.


Additional disclosures
1. This report is dated as at 21 March 2025.
2. All market data included in this report are dated as at close 03 March 2025, unless a different date and/or a specific time of day is indicated in the report.
3. HSBC has procedures in place to identify and manage any potential conflicts of interest that arise in connection with its Research business. HSBC's analysts and its other staff who are involved in the preparation and dissemination of Research operate and have a management reporting line independent of HSBC's Investment Banking business. Information Barrier procedures are in place between the Investment Banking, Principal Trading, and Research businesses toensure that any confidential and/or price sensitive information is handled in an appropriate manner.
4. You are not permitted to use, for reference, any data in this document for the purpose of (i) determining the interest payable, or other sums due, under loan agreements or under other financial contracts or instruments, (ii) determining the price at which a financial instrument may be bought or sold or traded or redeemed, or the value of a financial instrument, and/or (iii) measuring the performance of afinancial instrument or of an investment fund.

