
4 Sep 2024
A couple of years ago, we pointed out that reservoir levels matter more than rains for India’s food production and inflation. In this report, we go a step further, moving from rains and reservoirs to temperatures. We find that temperatures do a much better job in explaining and predicting food output and inflation.
Average temperatures and their volatility have risen over time. Global warming is indeed a well-documented reality. In India, the impact of the March 2022 and March 2024 heatwaves are fresh in the mind. The correlation between average temperatures and India’s food inflation has risen sharply over the last decade. And this is true across individual food groups –perishable crops, durable crops, and animal protein sources.
This, then, brings us to another important question. If the importance of temperature has risen over time, what role do rains and reservoirs play? We bring out our trusted food inflation model, which explains food inflation with changes in reservoir levels, minimum support prices, and government food management steps. When we throw in temperatures, reservoir levels lose importance. They get ‘crowded out’. When we include temperatures but exclude reservoirs, the model becomes even better than before in predicting food inflation (i.e. the R-squared rises). What does this mean?
Temperatures have become far better than rainfall in explaining and forecasting food inflation. There are several possible reasons. One, with irrigation facilities improving over time, the impact of low rains can be better managed, while there’s no magic wand for rising temperatures. Two, reservoir levels and temperatures have a 50% correlation. A lot of the information contained in the reservoir variable gets picked up by temperatures. Three, there is a non-linear relationship between temperatures and food inflation. With temperatures rising, the sensitivity of non-perishable food inflation to average temperatures has grown even faster than perishables (5x vs 3x over 10 years).
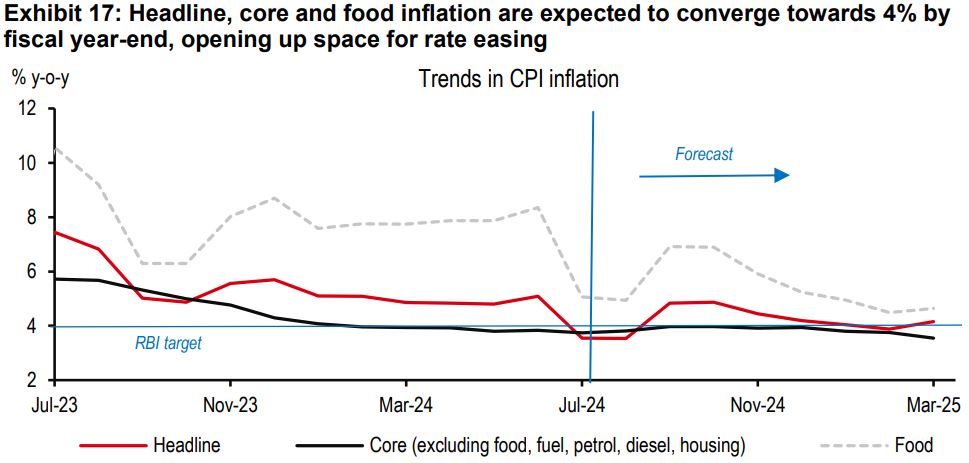
What should we expect in the short run? Following the debilitating March heatwave, temperatures have normalised. Applying our model coefficient, food inflation could fall by 2ppt over the next few months, lowering headline inflation by 1ppt. Headline inflation has averaged about 5% so far in 2024. By end-2024, headline, core, and food inflation are all likely to converge towards the 4% target, opening up space for rate easing. We expect two 25bp repo rate cuts, taking the policy repo rate to 6% by March 2025.
A couple of years ago, we pointed out that reservoir levels matter more than rains for India’s food production and inflation, as reservoirs not only capture contemporaneous rains, but also hold rain that has fallen in previous rain episodes. This is important at a time when unseasonal showers have increased in frequency.
In a more recent report, we pointed out that trends in reservoir levels have changed in recent years. For instance, they are much lower now in the important sowing month of July than they used to be. Not a surprise that seasonality patterns in food prices are changing too.
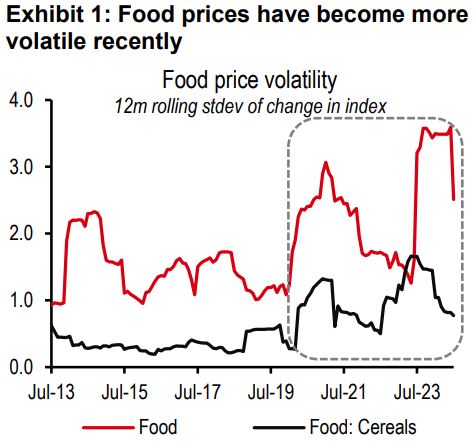
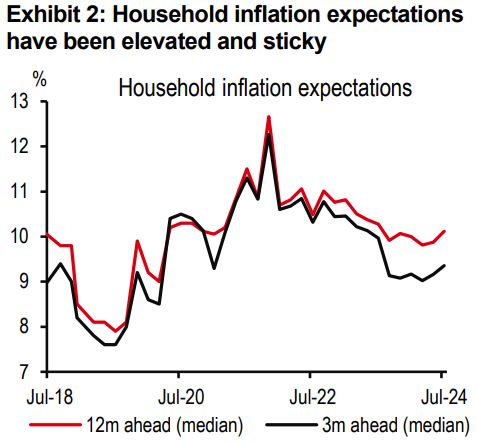
All these weather changes are making inflation more volatile and inflation expectations harder to anchor (see exhibits 1 and exhibit 2). It is no surprise that inflation forecasting errors have risen.
In this report, we take a next step, from rains and reservoirs to temperatures. True, the two are somewhat correlated. Periods of low rainfall tend to have higher temperatures.
Climate events like El Niño are associated with low rains and high temperatures, and climate events like La Niña are associated with stronger rains and lower temperatures[@india-economics-08-01]. We find a 50% negative correlation between rains and temperatures over the last two-odd decades.
Yet, we find that temperatures carry more information than rains and do a much better job in explaining and predicting food output and inflation. There are some good reasons why you should be tracking temperatures more closely than you have in the past.
Let’s explain.
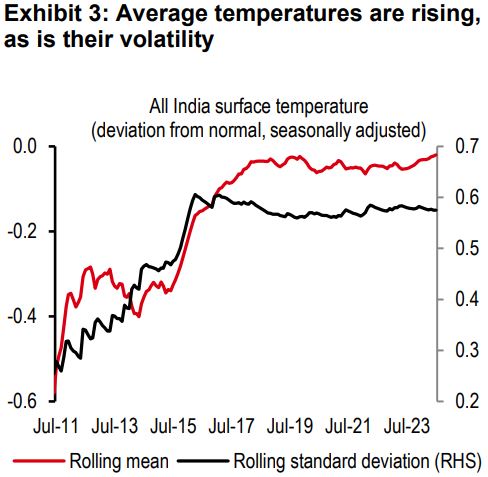
We have an extensive database of average surface temperatures across India since the 1950s. We created a monthly deviation-from-normal series, which shows that average temperatures are rising over time. And alongside this, so is temperature volatility (see exhibit 3). Neither of these is a surprise. Global warming is indeed a well-documented reality.
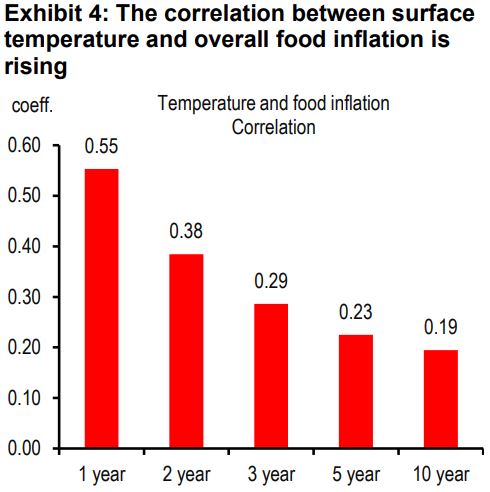
What we find next is that, with an appropriate lag, the correlation between average temperature and India’s food inflation has been rising consistently over time (see exhibit 4). As the earth is heating up, crop yields are falling.
Indeed, scientists and researchers project that a 2.5-4.9 degrees Celsius increase in temperature across the country could lead to a decrease in wheat yields of 41-52%, and a fall in rice yields of 32-40%[@india-economics-08-02]
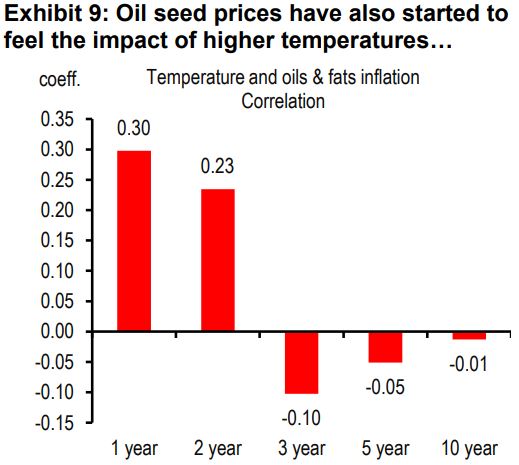
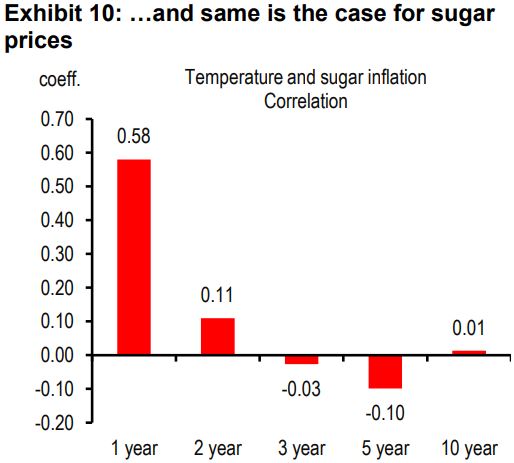
The heatwave of March 2022 lowered the sugar cane crop yield by 30%, while hurting the production of vegetables, as well as oilseeds[@india-economics-08-03]. In the heatwave of March 2024, temperatures rose to 50.5 degrees Celsius in some areas, leading to heat stress. The sharp rise in vegetable prices was a reflection of the crop damage[@india-economics-08-04].
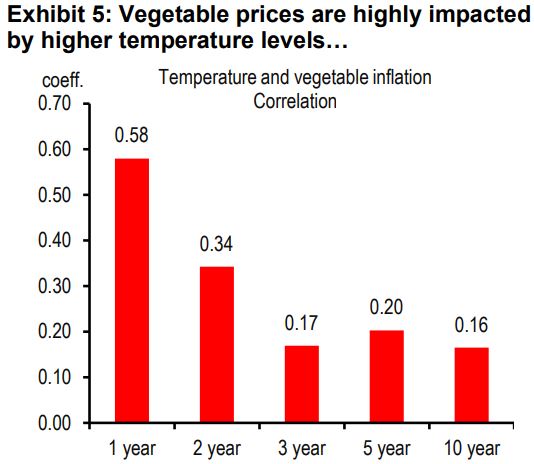
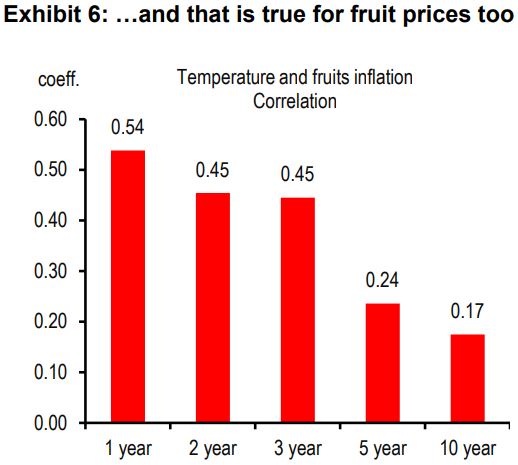
All of this is clearly visible across various food items. Analysing a decade of data, we find the correlation between average temperature and food inflation has been rising across all the main crops – perishables (vegetables and fruits) and durables (cereal, pulses, oilseeds and sugar).
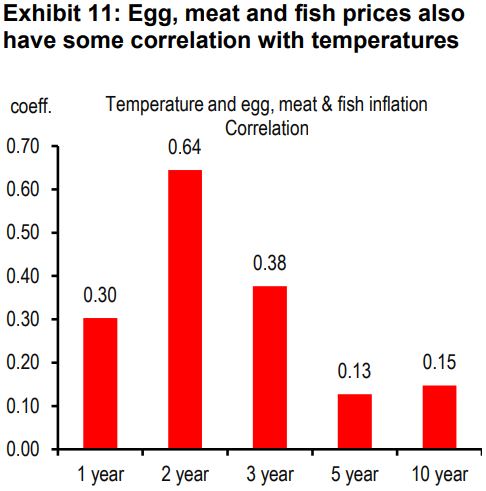
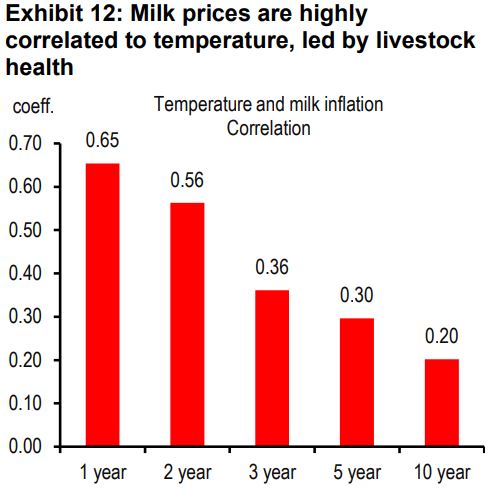
And this is not just limited to crops. Even the price of dairy, poultry and fishery products, which we, on aggregate, call animal protein sources of food, are becoming increasingly sensitive to rising temperatures (see exhibits 5-12).
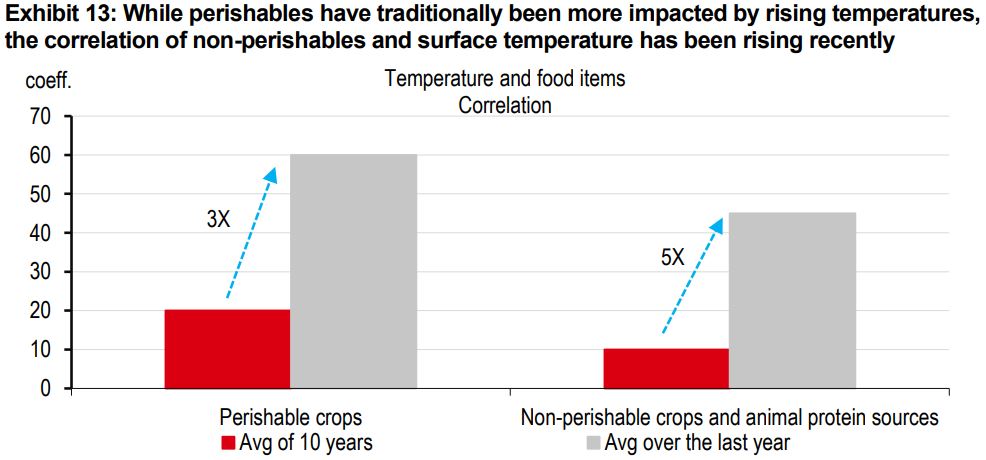
Most perishable crops are short-cycle crops (e.g. vegetables, where a new crop can be harvested every 2-3 months). These crops have traditionally been more sensitive to heatwaves than others, and this sensitivity is rising. We find the average correlation between temperature and price for the perishables to have risen from 20% (average of 10 years) to 60% (average over the last year), marking a 3-fold increase (see exhibit 13).
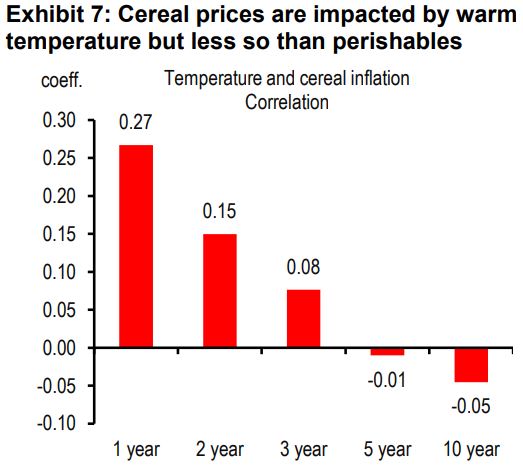
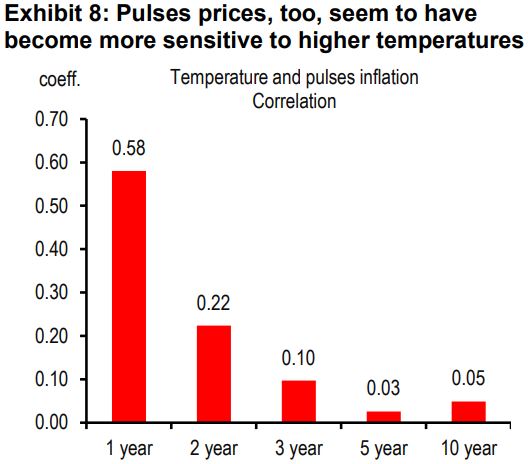
Durable crops are long-cycle crops (e.g. cereal, which are harvested every 6-12 months). Together with the animal protein sources, they have traditionally been less sensitive to temperatures, but sensitivity is growing, with the correlation rising from 10% (average of 10 years) to 45% (average over the last year), marking a 5-fold increase.
This, then, brings us to another important question. If the sensitivity of food production and inflation to temperatures has risen over time, what role do rains and reservoirs play?
To answer this carefully, we get a little more technical than just running correlations. We bring out our trusted food inflation OLS model, which can help us parse the role of temperatures on food inflation better, while including other variables that also impact food inflation.
First, we re-run our old food inflation model for the 2007-2024 period (see regression 1 in exhibit 14). It includes:
Each of these variables is economically and statistically significant in explaining food inflation trends. The model has a strong R-squared of 82%.
Next, we include temperature in our model (see regression 2 in exhibit 14). And it doesn’t sit too comfortably with the other variables. The temperature variable is clearly statistically significant, but the reservoir variable turns insignificant. This could mean that temperature is crowding out the significance of reservoirs. Perhaps the temperature variable contains all the information which the rainfall variable holds, and more. Because, the fit of the model improves. R-squared increases from 82% to 88%.
Finally, we keep the temperature variable in the model but remove the reservoir variable (see regression 3 in exhibit 14). And this drastically improves our model. Each of the explanatory variables is economically and statistically significant. And the model’s R-squared is at an elevated 88%.
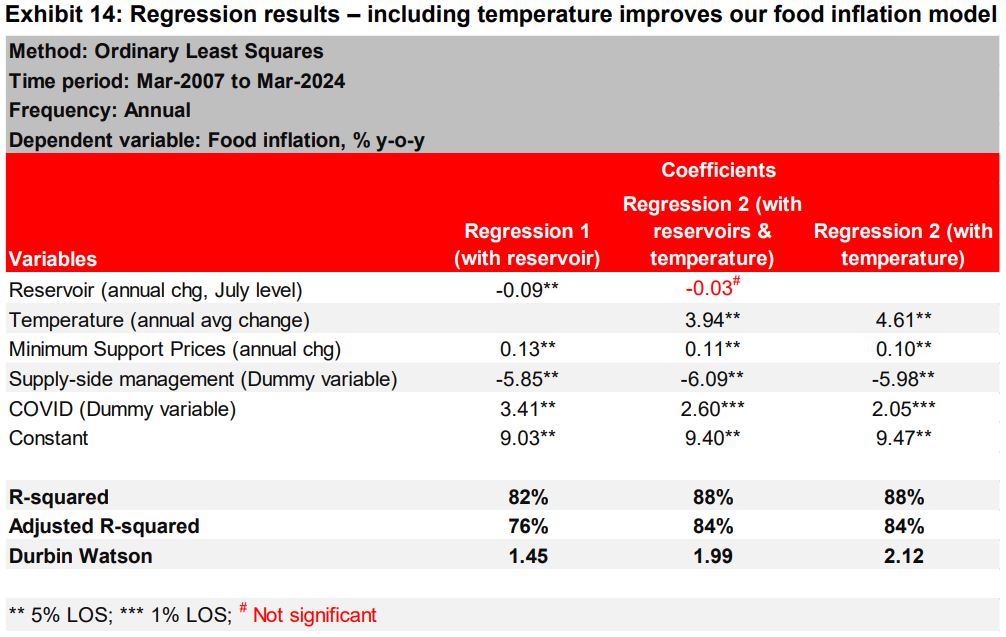
Temperatures are far superior than rainfall in explaining and forecasting food inflation. In fact, once temperatures are included, there is no value in analysing rains and reservoir levels.
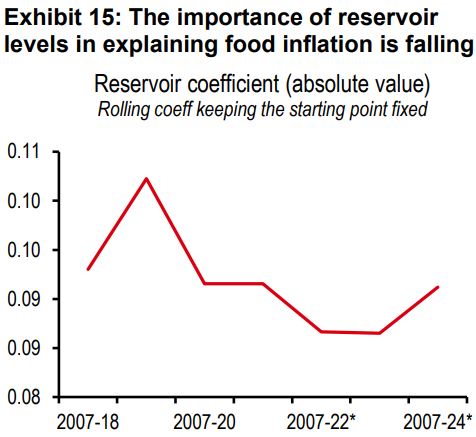
Indeed, over time, the coefficient of reservoir in our regression model has been falling, indicating than its importance has dwindled (see exhibit 15). There could be a couple of reasons for this.
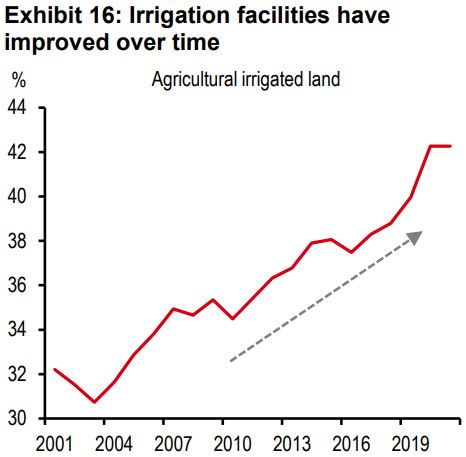
One,with irrigation facilities improving over time, the low rains problem has been partly circumvented, especially in certain areas like north-western India (which is also known as the food bowl of the country).
Two, with reservoirs and temperatures having a 50% correlation, our sense is that a lot of the meaningful information contained in the reservoir variable gets picked up by temperatures.
Three, there is a non-linear relationship between temperatures and food inflation. As we saw above, with temperatures having crossed certain thresholds, the sensitivity of non-perishable food inflation to higher temperatures has grown even faster than for perishables (5x vs 3x over the last decade, though in level terms, the correlation is higher for perishables).
The heatwave in March to May 2024 were characterised by temperatures which were, on average, 1.5-2 degrees Celsius higher than the previous year.
Since then, temperatures have normalised. The El Niño weather phenomenon from last year has made way for La Niña, associated with cooler temperatures and stronger precipitation.
Temperatures have fallen c0.5 degrees Celsius over the last month (compared to the Mar-Jun period). Applying our model coefficient, if this persists, food inflation could fall by 2ppt over the next few months, lowering headline inflation by 1ppt.
Headline inflation has averaged just below 5% so far in 2024. With normalising temperatures and falling food prices, it could fall to c4% by end-2024 (see exhibit 17). In fact, by March-2025, headline, core, and food inflation, are all likely to converge towards the 4% target.
Indeed, with temperatures cooling after a severe heatwave earlier this year, we expect the RBI to start easing rates in 4Q2024. We expect two 25bp repo rate cuts, taking the policy repo rate to 6% by March 2025.
While this is good news at a time when temperatures are normalising, it is worth keeping it in the back of our minds that over the medium term, rising temperatures could become a big problem for inflation management. The impact of weak rains can be managed by better irrigation facilities, but there is no magic wand to manage the impact of rising temperatures.


Additional disclosures
1. This report is dated as at 29 August 2024.
2. All market data included in this report are dated as at close 28 August 2024, unless a different date and/or a specific time of day is indicated in the report.
3. HSBC has procedures in place to identify and manage any potential conflicts of interest that arise in connection with its Research business. HSBC's analysts and its other staff who are involved in the preparation and dissemination of Research operate and have a management reporting line independent of HSBC's Investment Banking business. Information Barrier procedures are in place between the Investment Banking, Principal Trading, and Research businesses toensure that any confidential and/or price sensitive information is handled in an appropriate manner.
4. You are not permitted to use, for reference, any data in this document for the purpose of (i) determining the interest payable, or other sums due, under loan agreements or under other financial contracts or instruments, (ii) determining the price at which a financial instrument may be bought or sold or traded or redeemed, or the value of a financial instrument, and/or (iii) measuring the performance of afinancial instrument or of an investment fund.
This document is prepared by The Hongkong and Shanghai Banking Corporation Limited (‘HBAP’), 1 Queen’s Road Central, Hong Kong. HBAP is incorporated in Hong Kong and is part of the HSBC Group. This document is distributed by HSBC Continental Europe, HBAP,HSBC Bank (Singapore) Limited, HSBC Bank (Taiwan) Limited, HSBC Bank Malaysia Berhad (198401015221 (127776-V))/HSBC Amanah Malaysia Berhad (200801006421 (807705-X)), The Hongkong and Shanghai Banking Corporation Limited, India (HSBC India), HSBC Bank Middle East Limited, HSBC UK Bank plc, HSBC Bank plc, Jersey Branch, and HSBC Bank plc, Guernsey Branch, HSBC Private Bank (Suisse) SA, HSBC Private Bank (Suisse) SA DIFC Branch, HSBC Private Bank Suisse SA, South Africa Representative Office, HSBC Financial Services (Lebanon) SAL, HSBC Private banking (Luxembourg) SA and The Hongkong and Shanghai Banking Corporation Limited (collectively, the “Distributors”) to their respective clients. This document is for general circulation and information purposes only. This document is not prepared with any particular customers or purposes in mind and does not take into account any investment objectives, financial situation or personal circumstances or needs of any particular customer. HBAP has prepared this document basedon publicly available information at the time of preparation from sources it believes to be reliable but it has not independently verified such information. The contents of this document are subject to change without notice. HBAP and the Distributors are not responsible for any loss, damage or other consequences of any kind that you may incur or suffer as a result of, arising from or relating to your use of or reliance on this document. HBAP and the Distributors give no guarantee, representation or warranty as to the accuracy, timeliness or completeness of this document. This document is not investment advice or recommendation nor is it intended to sell investments or servicesor solicit purchases or subscriptions for them. You should not use or rely on this document in making any investment decision. HBAP and the Distributors are not responsible for such use or reliance by you. You should consult your professional advisor in your jurisdiction if you have any questions regarding the contents of this document. You should not reproduce or further distribute the contents of this document to any person or entity, whether in whole or in part, for any purpose. This document may not be distributed to any jurisdiction where its distribution is unlawful.
The following statement is only applicable to HSBC Bank (Taiwan) Limited with regard to how the publication is distributed to its customers: HSBC Bank (Taiwan) Limited (“the Bank”) shall fulfill the fiduciary duty act as a reasonable person once in exercising offering/conducting ordinary care in offering trust services/business. However, the Bank disclaims any guaranty on the management or operation performance of the trust business. The following statement is only applicable to by HSBC Bank Australia with regard to how the publication is distributed to its customers: This document is distributed by HSBC Bank Australia Limited ABN 48 006 434 162, AFSL/ACL 232595 (HBAU). HBAP has a Sydney Branch ARBN 117 925 970 AFSL 301737.The statements contained in this document are general in nature and do not constitute investment research or a recommendation, or a statement of opinion (financial product advice) to buy or sell investments. This document has not taken into account your personal objectives, financial situation and needs. Because of that, before acting on the document you should consider its appropriateness to you, with regard to your objectives, financial situation, and needs.
Important Information about the Hongkong and Shanghai Banking Corporation Limited, India (“HSBC India”) HSBC India is a branch of The Hongkong and Shanghai Banking Corporation Limited. HSBC India is a distributor of mutual funds and referrer of investment products from third party entities registered and regulated in India. HSBC India does not distribute investment products to those persons who are either the citizens or residents of United States of America (USA), Australia or New Zealand or any other jurisdiction where such distribution would be contrary to law or regulation.
Mainland China In mainland China, this document is distributed by HSBC Bank (China) Company Limited (“HBCN”) and HSBC FinTech Services (Shanghai)Company Limited to its customers for general reference only. This document is not, and is not intended to be, for the purpose of providing securities and futures investment advisory services or financial information services, or promoting or selling any wealth management product. This document provides all content and information solely on an "as-is/as-available" basis. You SHOULD consult your own professional adviser if you have any questions regarding this document.
The material contained in this document is for general information purposes only and does not constitute investment research or advice or a recommendation to buy or sellinvestments. Some of the statements contained in this document may be considered forward looking statements which provide current expectations or forecasts of future events. Such forward looking statements are not guarantees of future performance or events and involve risks and uncertainties. Actual results may differ materially from those described in such forward-looking statements as a result of various factors. HSBC India does not undertake any obligation to update the forward-looking statements contained herein, or to update the reasons why actual results could differ from those projected in the forward-looking statements. Investments are subject to market risk, read all investment related documents carefully.
© Copyright 2024. The Hongkong and Shanghai Banking Corporation Limited, ALL RIGHTS RESERVED. No part of this document may be reproduced, stored in a retrieval system, or transmitted, on any form or by any means, electronic, mechanical, photocopying, recording or otherwise, without the prior written permission of The Hongkong and Shanghai Banking Corporation Limited.
Important information on sustainable investing “Sustainable investments” include investment approaches or instruments which consider environmental, social, governance and/or other sustainability factors (collectively, “sustainability”) to varying degrees. Certain instruments we include within this category may be in the process of changing to deliver sustainability outcomes. There is no guarantee that sustainable investments will produce returns similar to those which don’t consider these factors. Sustainable investments may diverge from traditional market benchmarks. In addition, there is no standard definition of, or measurement criteria for sustainable investments, or the impact of sustainable investments (“sustainability impact”). Sustainable investment and sustainability impact measurement criteria are (a) highly subjective and (b) may vary significantly across and within sectors.
HSBC may rely on measurement criteria devised and/or reported by third party providers or issuers. HSBC does not always conduct its own specific due diligence in relation to measurement criteria. There is no guarantee: (a) that the nature of the sustainability impact or measurement criteria of an investment will be aligned with any particular investor’s sustainability goals; or (b) that the stated level or target level of sustainability impact will be achieved. Sustainable investing is an evolving area and new regulations may come into effect which may affect how an investment is categorised or labelled. An investment which is considered to fulfil sustainable criteria today may not meet those criteria at some point in the future.

